

Electrical Characteristics of PV Modules |
|||||||||||||
Equivalent electric circuit
For the purpose of the electrical characteristics of a solar cell, the inside of that black box can be described by an electric cicuit with only 4components:
The relationship between I and U of a single cell is then expressed by: with temperature, T (in Kelvin), Boltzmann constant k = 1.38e-23 and the elementary charge e = 1.602e-19. Using this formula, we can calculate maximum power points, but also behaviour under different temperatures. In a module, a number of cells are put in series into a string, and a number of strings in parallel. Putting cells in series adds to the voltage, whereas putting cells in parallel adds to the current, so that: |
|||||||||||||
Current-Voltage Curve: I-U CharacteristicsThe I-U equation can only be solved iteratively. The graph to the right shows a typical curve. Sensitivity: The curve is highly sensitive to changes in:
|
|||||||||||||
In practice, none of the parameters in the I-U characterisitc curve can be directrly observed. Instead, manufactureres provide the following data:
|
|||||||||||||
Relative Module EfficiencyHere is a typical curve for relative efficiency over the intensity of the incoming light for different temperatures. Naturally, at 25°C and 1,000W/m2 the relative efficiency is 1.0, as these are the standard test conditions.Nevertheless, the conversion efficiency is nearly constant over a wide range of intensities, only dropping sharply below 10% of the standard 1,000W. Changes in temperature cause the curve to shift upwards (if colder) or downwards (if warmer). Silicon is more sensitive to temperature changes than many of the thin-fim materials. |
|||||||||||||
Maximum Power TrackingWith light varying its intensity throughout the day, the maximum power point moves to different voltages and currents. That means, if, for instance, the voltage is forced to be constant, the solar module will most likely not operate in its power optimum.In practice, a Maximum Power Point Tracker (MPP), is inserted between the solar module and the load (its output) in order to ensure optimum operation. Such MPP tracker is an adjustable DC- to DC transformer, which contains a high frequency switch providing a matching between the load and the solar module. Manufacturers quote 2 efficiency factors:
Most MPP trackers are "step-down trackers", driving a high-voltage load from a low-voltage solar module. For instance: MPP input voltage range 200 - 400V transformed into a maximum voltage of 550V.
|
|||||||||||||
Solar Power
» Technologies
 A solar module can be seen as a black box that with two connectors, producing a current, I, at a voltage, U.
 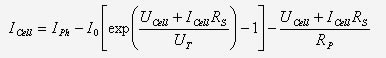 with thermal voltage
Join us
|
Join us on Linkedin
Subscribe to our blog
Follow us on Twitter
Follow us on Facebook
|
<< previous | next >> |
|
| About | Terms of Use | Sitemap | Contact Us | ©2016 Green Rhino Energy Ltd. |